In today’s data-driven world, organizations are constantly seeking ways to harness the power of data to make informed decisions, gain competitive advantages, and drive innovation. Two critical components in this process are ETL (Extract, Transform, Load) and data visualization. ETL is responsible for gathering, cleaning, and transforming raw data into a usable format, while data visualization tools help in making this data understandable and actionable. This article explores the significance of ETL and data visualization in unleashing the power of data.
Understanding ETL: The Data Transformation Process
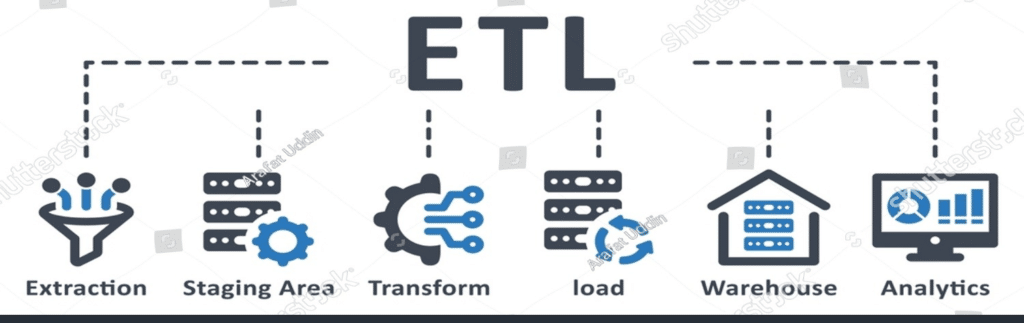
ETL is a crucial process in the data lifecycle. It serves as the foundation upon which data-driven decision-making is built. Let’s break down each component of ETL:
1. Extract
The first step in ETL is extraction. Here, data is collected from various sources, which can include databases, spreadsheets, APIs, web scraping, and more. This raw data is often unstructured and heterogeneous, making it unsuitable for analysis or reporting.
2. Transform
The next phase is transformation, where raw data is cleaned, standardized, and converted into a consistent format. This step involves data validation, handling missing values, removing duplicates, and aggregating or separating data as needed. Transformations may also involve complex operations such as data enrichment, where additional information is merged with the original dataset to enhance its quality and utility.
3. Load
The final step is loading. Transformed data is stored in a suitable repository, often a data warehouse or data lake, making it readily accessible for analysis and reporting. Data warehouses are designed to optimize query performance, allowing organizations to retrieve insights from their data more efficiently.
The Significance of ETL
ETL plays a pivotal role in data management for several reasons:
1. Data Quality Improvement
ETL processes ensure that data is clean, accurate, and consistent. This is critical for avoiding misleading insights and making reliable decisions.
2. Data Integration
ETL enables the integration of data from disparate sources, providing a holistic view of an organization’s operations. This comprehensive perspective is invaluable for strategic planning and decision-making.
3. Historical Data Preservation
By storing historical data, ETL processes allow organizations to track changes over time and identify trends and patterns that can inform future strategies.
4. Automation
Automation of ETL processes reduces the risk of human error, accelerates data processing, and ensures timely access to information.
The Role of Data Visualization
While ETL sets the stage by preparing data for analysis, data visualization takes center stage by making this data comprehensible and actionable. Data visualization involves representing data graphically, allowing users to easily grasp complex information. Here’s why data visualization is crucial:
1. Simplifying Complex Data
Data visualization simplifies complex datasets by representing them visually through charts, graphs, and dashboards. This simplification aids in better understanding and interpretating the data.
2. Facilitating Decision-Making
Visualizations enable stakeholders to make data-driven decisions more effectively. Patterns, trends, and outliers are more evident in graphical formats, empowering users to act upon insights quickly.
3. Communication
Visualizations are a powerful communication tool. They make it easier to convey information to a diverse audience, including those who may not have a deep understanding of data analysis.
4. Real-Time Monitoring
Dashboards with real-time data visualizations allow organizations to monitor key performance indicators (KPIs) and respond promptly to changing circumstances.
The Synergy Between ETL and Data Visualization
The synergy between ETL and data visualization is where the true power of data is unleashed. ETL ensures that data is accurate and ready for analysis, while data visualization presents this data in a user-friendly manner. This synergy creates a seamless process for gaining insights from data:
1. Data Collection: ETL collects data from various sources.
2. Data Transformation: ETL processes clean, enrich, and structure the data.
3. Data Loading: Transformed data is loaded into a data warehouse or other storage.
4. Data Visualization: Visualization tools access the data warehouse and create interactive visualizations.
5. Data Exploration: Users explore data through charts, graphs, and dashboards.
6. Insights and Decision-Making: Stakeholders make data-driven decisions based on visualized insights.
This iterative process ensures that organizations can continuously adapt their operations, respond to changing market conditions, and identify opportunities for growth and efficiency.
Key ETL and Data Visualization Tools
Several ETL and data visualization tools are available in the market. Here are some popular choices:
ETL Tools:
1. Apache Nifi: An open-source data integration tool that supports data extraction, transformation, and loading.
2. Talend: A comprehensive ETL platform with data integration, data quality, and data governance capabilities.
3. Informatica: Offers a wide range of ETL and data integration solutions for enterprises.
Data Visualization Tools:
1. Tableau: Known for its interactive and user-friendly dashboards, Tableau is a leading data visualization tool.
2. Power BI: Developed by Microsoft, Power BI is a powerful tool for creating reports and dashboards.
3. QlikView/Qlik Sense: Qlik’s solutions offer associative data modelling and interactive visualizations.
4. D3.js: A JavaScript library for creating custom, interactive data visualizations in web applications.
How Data Helps Businesses:
The Power of Informed Decision-Making
In today’s fast-paced and competitive business landscape, the ability to make informed decisions is crucial for success. One of the most valuable assets for businesses in this endeavour is data. Whether you’re a small startup or a multinational corporation, data plays a pivotal role in every aspect of operations, from strategic planning to day-to-day activities. In this article, we will explore how data helps businesses thrive and stay ahead in the ever-evolving market.
1. Understanding Customer Behaviour
Data is a treasure trove of insights into customer behaviour. By analysing customer data, businesses can understand their target audience better. This includes understanding their preferences, buying habits, and pain points. Armed with this knowledge, businesses can tailor their products, services, and marketing efforts to meet customer expectations more effectively. Data-driven insights allow businesses to create personalized experiences that lead to increased customer satisfaction and loyalty.
2. Improving Operational Efficiency
Data helps businesses optimize their operations. Through data analysis, companies can identify bottlenecks, inefficiencies, and areas where cost savings can be achieved. For example, supply chain data can be used to streamline inventory management, reduce shipping costs, and minimize stockouts. This not only improves efficiency but also saves money and enhances overall performance.
3. Strategic Decision-Making
Data-driven decision-making is the cornerstone of strategic planning. Businesses can use data to assess market trends, competition, and emerging opportunities. This information enables executives and leaders to make informed choices about the direction of the company, such as entering new markets, diversifying product offerings, or investing in research and development. Without data, strategic decisions become guesswork, and the risk of making costly mistakes increases significantly.
4. Enhancing Marketing Campaigns
Marketing is one area where data shines. Businesses can collect data on the performance of marketing campaigns, including metrics like click-through rates, conversion rates, and customer acquisition costs. By analyzing this data, companies can refine their marketing strategies, allocate resources more effectively, and target the right audience with the right message at the right time. This leads to higher ROI on marketing investments.
5. Predictive Analytics
Data allows businesses to look into the future. By employing predictive analytics, companies can forecast trends, demand patterns, and potential issues. For instance, predictive maintenance uses data from equipment sensors to predict when machinery is likely to fail, allowing for timely maintenance and reducing downtime. Predictive analytics empowers businesses to be proactive rather than reactive, saving time and resources.
6. Innovation and Product Development
Data-driven innovation is a powerful force. Businesses can use data to identify gaps in the market, uncover unmet customer needs, and generate new product or service ideas. Data can also provide valuable feedback on existing products or services, helping companies iterate and improve continuously. By leveraging data, businesses can stay at the forefront of innovation and maintain a competitive edge.
7. Risk Management
Data plays a vital role in risk assessment and management. Companies can use historical data to identify potential risks, such as market volatility, economic downturns, or supply chain disruptions. By understanding these risks, businesses can develop mitigation strategies and contingency plans to minimize the impact of adverse events.
8. Customer Feedback and Satisfaction
Customer feedback is a rich source of data that helps businesses gauge customer satisfaction and identify areas for improvement. Surveys, reviews, and social media comments provide valuable insights into what customers like and dislike about products and services. By actively collecting and analyzing customer feedback, businesses can make necessary adjustments to enhance customer satisfaction and loyalty.
Conclusion
In the era of big data, organizations must harness the power of data to stay competitive and make informed decisions. ETL and data visualization are two indispensable components of this process. ETL ensures data is prepared and maintained at a high quality, while data visualization makes this data accessible and actionable. The synergy between these two elements creates a dynamic cycle of data-driven insights, leading to improved operations, innovation, and ultimately, success in today’s data-driven world.
In today’s data-driven world, businesses that harness the power of data have a distinct advantage. Data enables companies to understand their customers, optimize operations, make strategic decisions, and innovate. It empowers businesses to adapt to changing market conditions, mitigate risks, and stay ahead of the competition. As technology and data analytics continue to evolve, the role of data in business will only become more significant. Embracing a data-driven mindset and investing in the tools and talent needed to leverage data effectively is not just an option but a necessity for businesses looking to thrive in the 21st century.